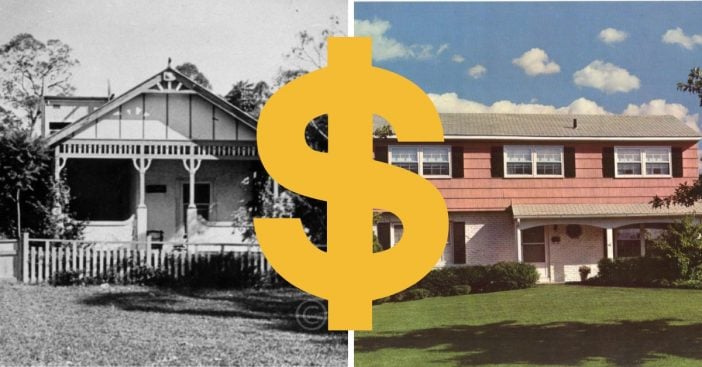
1960
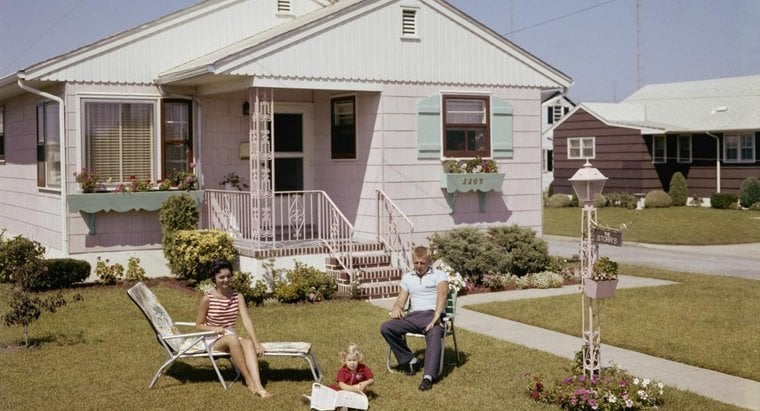
As expected, the average price of a home increased, but surprisingly only slightly! It stayed in the 12k range at $12,700, almost about what it was in 1958.
1961
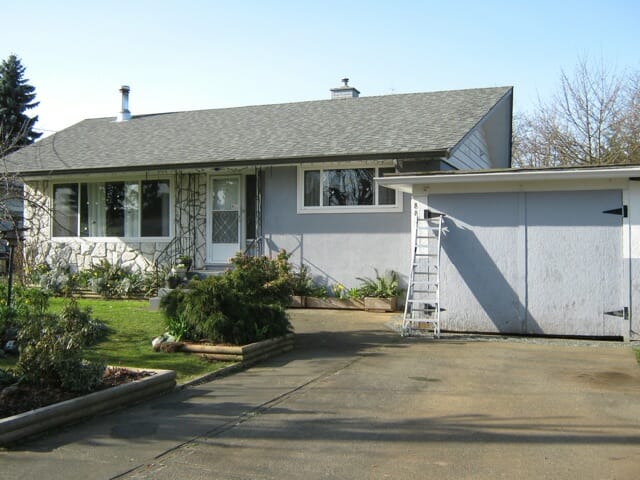
Another shocking surprise! The price for a home drops every so slightly once again to $12,500. Probably a good thing that it’s staying within the same range for quite a few years though. When will we begin to see a dramatic increase?
1962
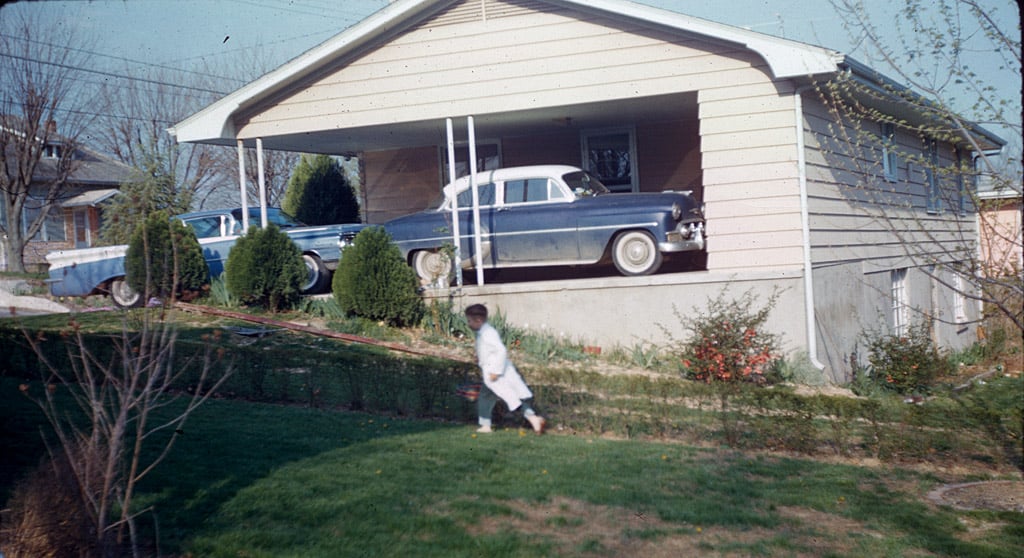
Shockingly enough, we see a stand-still. The average price for a home in 1962 remains at $12,500.
1963
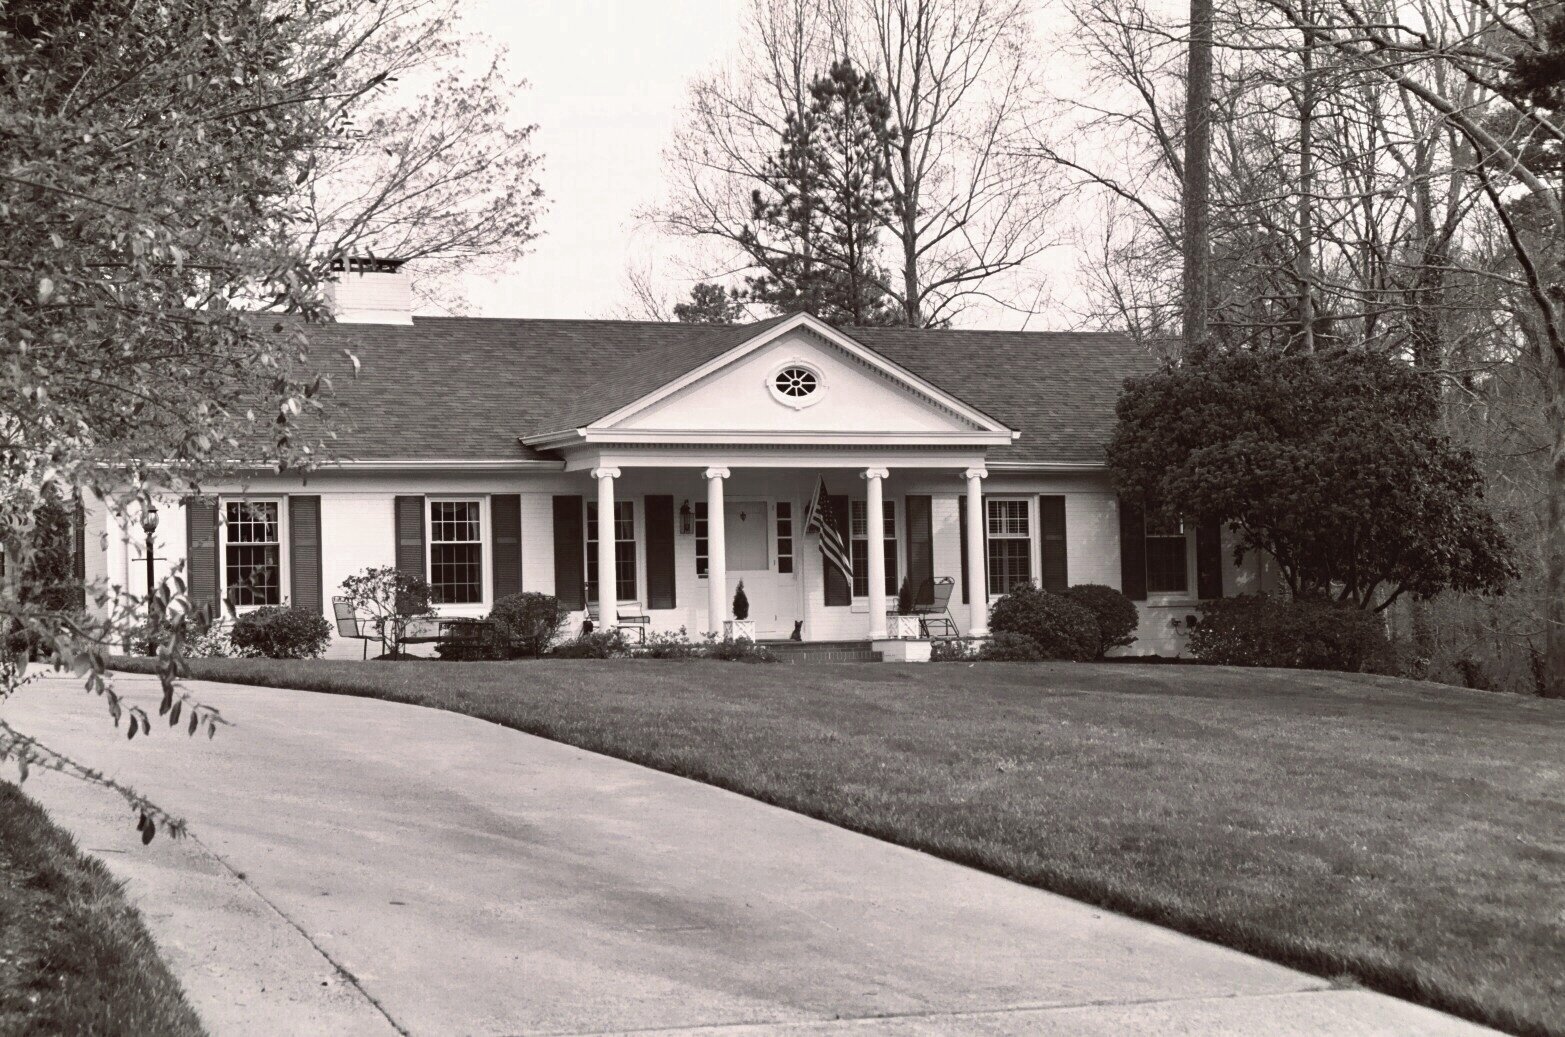
The price increases ever so slightly to $12,650 but stubbornly stays in the 12k range.
1964
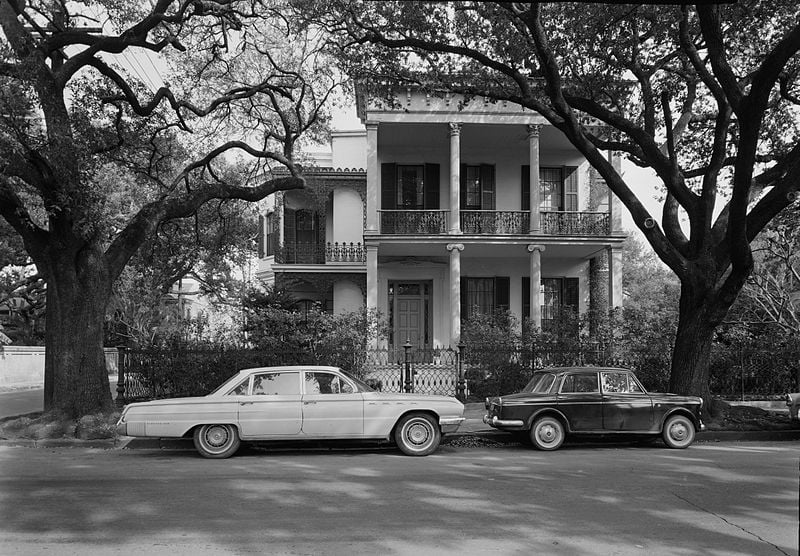
By 1964, the price range finally increases past the 13k mark at $13,050. But now the question is, will it rise, decrease, or stay the same? It’s incredibly unpredictable.
1965
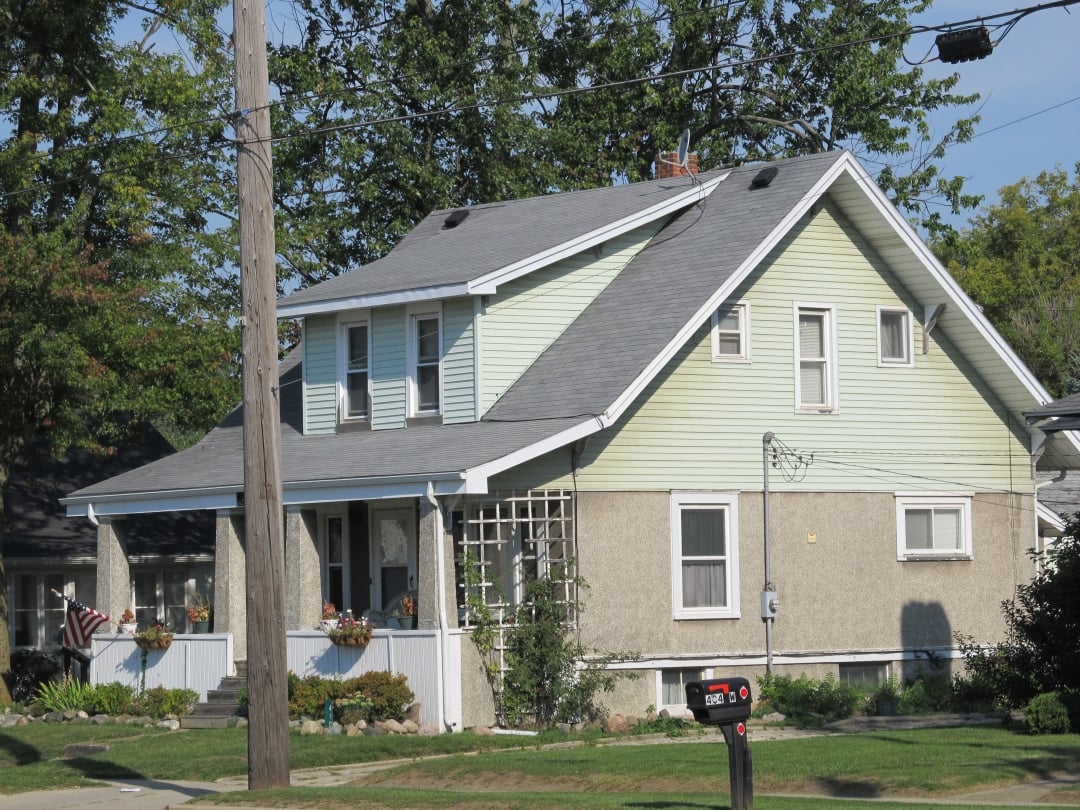
The price of a new home continues to rise in 1965 to $13,600.
1966
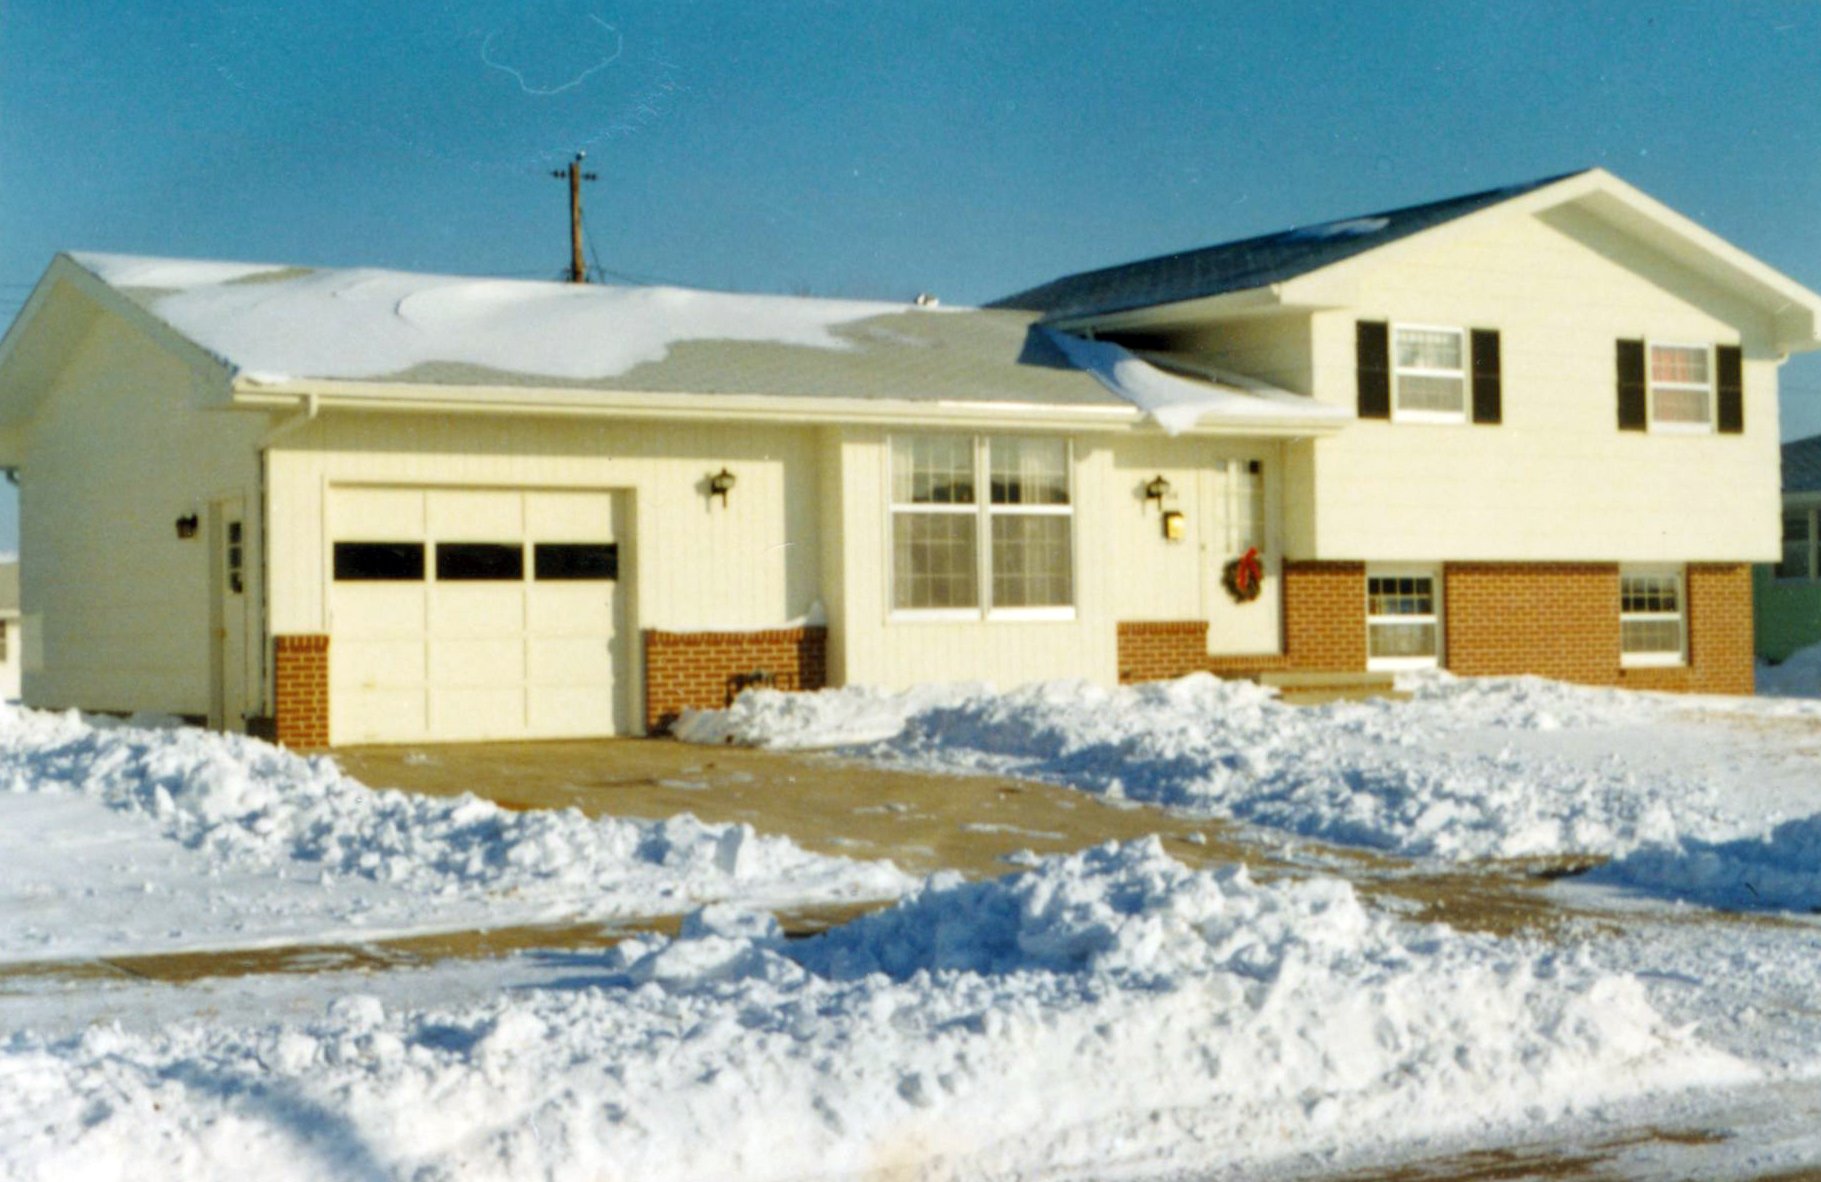
By 1966, we see a drastic increase in the average price of a home, standing at this point in time at $14,200.
1967
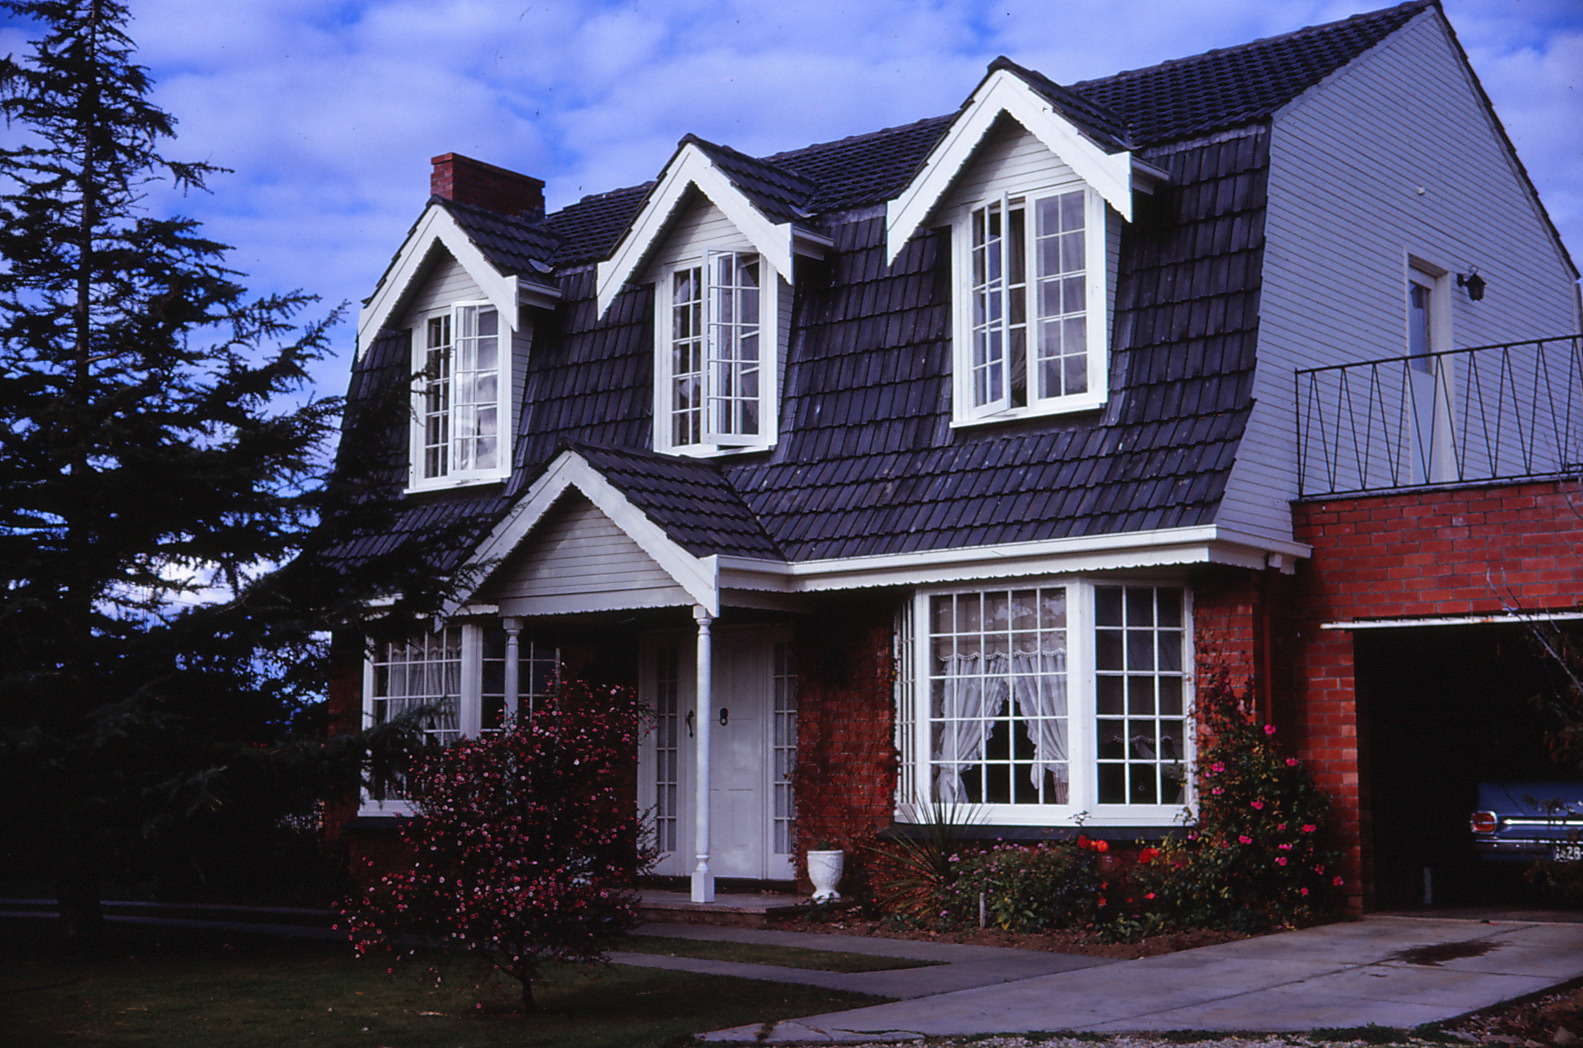
In 1967, we witness a slight increase to $14,250; not a huge blow.
1968
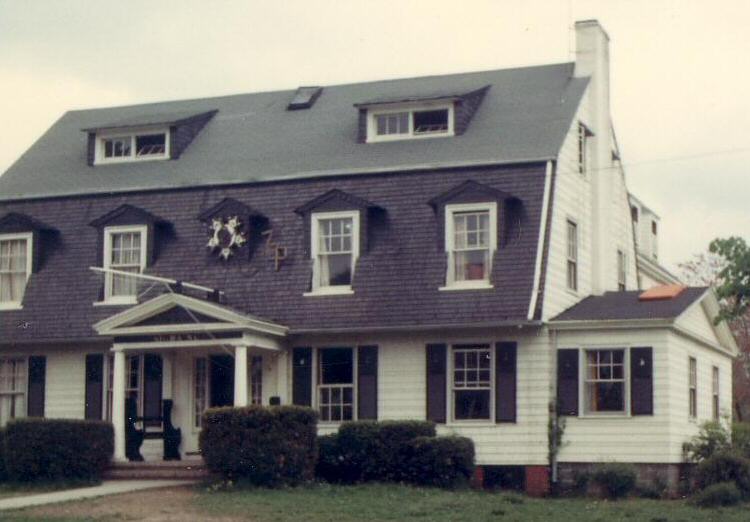
In 1968, the price range for a house was just shy of the 15k mark at $14,950, a pretty hefty increase from 1967.
1969
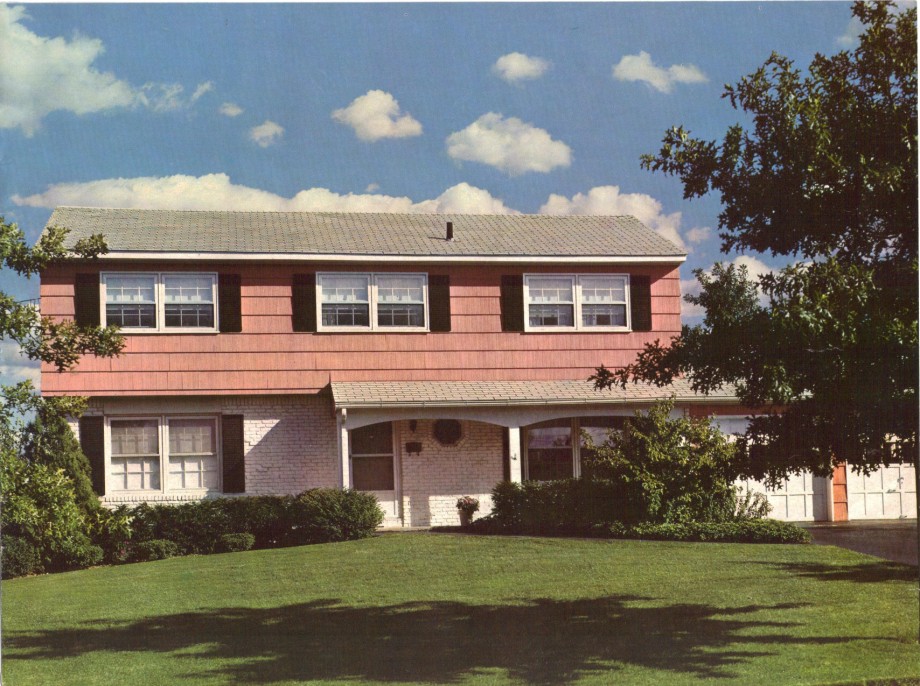
By 1969, the price has increased by another hefty amount, to $15,550.
1970
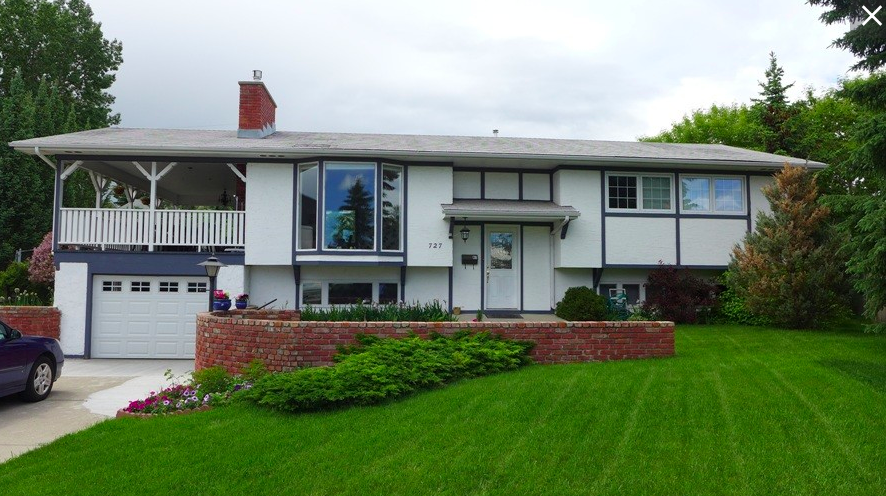
Now, the biggest shocker of them all. In a year’s time, the average price of a home expands rapidly to $23,450, with an inflation rate of 5.84% in the U.S. What?!
Now, as of October 2018? It costs an average price of $395,000 for a new home in the U.S. Wrap your head around that!
Be sure to SHARE this article if these prices surprised you!
